EFFECTS OF PROPYLENE GLYCOL INDUCED BIOGROWTH ON HYDRAULIC CONDUCTIVITY AND DISPERSIVITY OF A TWO-DIMENSIONAL HETEROGENEOUS POROUS MEDIA
Jessica Murphy Clarkson University
Dr. Angela Bielefeldt University of Colorado at Boulder
Summer 2002
Thanks to Angela Bielefeldt, JoAnn Silverstein, Jenny Baseman, and The National Science Foundation
Abstract
Concern is growing for the ground water in areas surrounding air force as well as local airport runways due to aircraft deicing fluids that are dripping off of planes upon take off. The primary component in these deicing fluids is Propylene Glycol, a carbon rich substance that is thought to be causing bioclogging within the soil of the areas around runways. The microbes living in the surrounding soils are able to degrade the Propylene Glycol by feeding on its available carbon, while doing so they are continually growing. This growth is termed biogrowth and will eventually clog the void spaces within the soil making ground water flow difficult. This bioclogging will cause rerouting of the ground water and can inhibit degradation of the deicing fluids.
Back to top
We have been looking into the effects of Propylene Glycol on the conductivity and dispersivity of heterogeneously pore-sized soil. It has been our findings that Propylene Glycol can to lead to lower hydraulic conductivities causing decreased water flow, as well as increased clogging in areas with greater void space. We have found that biogrowth caused by nutrients in Propylene Glycol does have differing effects on soils due to their relative porosities and can have adverse effects on degradation processes.
Proposal
Introduction
The contamination of sites surrounding airport runways has become a concern for the U.S. Air Force as well as public airports. These sites have been contaminated with aircraft de-icing fluids, of which propylene glycol is a major component. Although some of the excess fluid can be captured from the special de-icing pads and by way of drains along the runway large quantities, usually more then half of the fluid drips off of the planes after they leave the runway and then seeps into the soil.
Propylene glycol is expected to be readily biodegradable in soil, however when it reaches the soil PG will seep into the groundwater, where it is also expected to be readily biodegradable (MSDS). Propylene glycol is rich in carbon and bacteria living in the soil are able to use this carbon as a nutrient source. This causes bacteria growth, which will inevitably cause changes in soil characteristics. The bacteria growth has been termed bioclogging because it does not allow for normal water infiltration; therefore the contaminants must spread further before they are able to degrade (Butler, 1999). The purpose of this research is to observe what effects bioclogging will have on the fate and transport of these contaminants.
Background
There has been past research on the effects the growth of bacteria has on the hydraulic conductivity and dispersivity of the soil it lives in. Observations with variations of flowrate, loading, and nutrient conditions have been made, however most of these observations were based on 1-dimensional columns. In 1-dimensional columns it has been observed that hydraulic conductivity will drop significantly, as much as 1 to 3 orders of magnitude, this is assumed to be due to biogrowth. The more biomass involved the greater the head drop will be. A steady state conductivity is reached when the decay of biomass and shear forces are able to balance themselves with the biomass growth due to new carbon sources in the system. The column system is unable to accurately represent an actual field site due to its dimensional limitations. In these columns the water must flow through the clogged zone, though in the field if an area is clogged with biomass the water would reroute itself to another area free from biomass (Bielefeldt, Butler, McEachern, and Illangaskare, Draft).
Research in 2-dimensional tanks is better able to portray the actual movements of groundwater. Some experimental work involving the effects of decane, an element of jet fuel has been done by McEachern. Further tests by Butler were conducted using Propylene Glycol. A biozone was grown outside of a 2-dimensional homogeneous tank to be added after a period of growth in order to aid in modeling. A major problem with the modeling work came with the lack of desired contact between the tank sand and the transplanted biozone. These discrepancies produced somewhat insufficient data (Butler, 1999).
Problem Statement and Scope
In order to better understand the effects of biomass growth on contaminant fate, observations will be made using a 2-dimensional model. The model will include four zones of heterogeneity within the sand. This work will give more dimensional accuracy to the overall project as well as data from 2-dimensional work with heterogeneous sand.
Methods and Materials
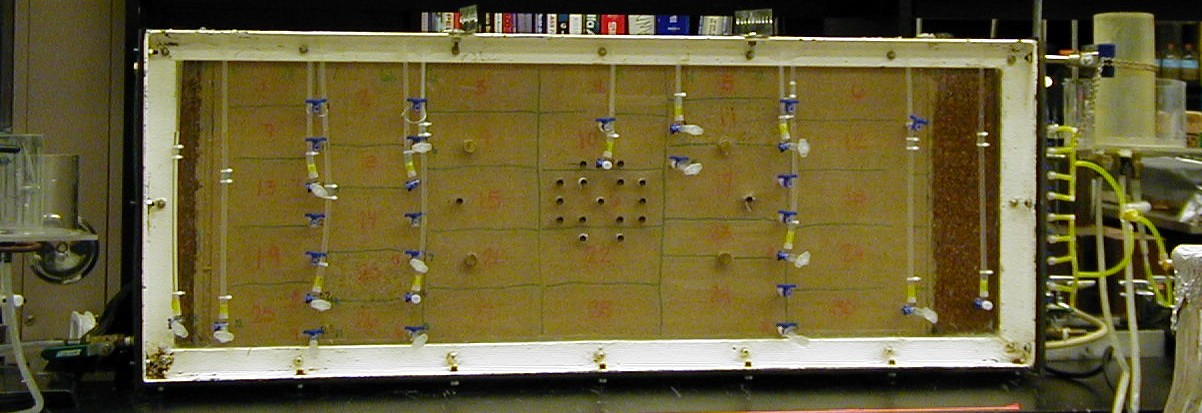
Experiments will be conducted in a tank 48.5” long x 18” high x 2.5” wide, having a 20:1 length to width ratio (see tank diagram below). The upstream and
Diagram 1
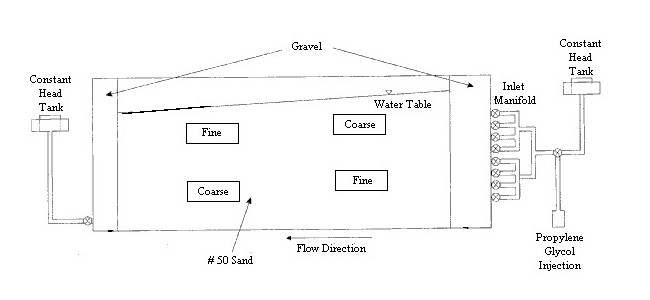
downstream ends of the tank will be attached to constant head apparatuses. The water will flow into the tank through a nine-port inlet manifold, fed by a submersible pump. Both ends of the tank will be packed with gravel, the majority of the tank will contain #50 sand, though it will also include four sectors consisting of #10 and #70 sands to allow for heterogeneity. Approximate characteristics of the 3 clean sand sizes as measured by other researchers are summarized in Table 1 below.
Table 1. Characteristics of Clean Sands
Sampling ports within the tank will be used though it is not certain at this time which or how many ports will be necessary. A number of ports will be required to measure head using glass pipettes that will act as vertical piezometers. The locations of these piezometeres will be at the ends of the tank and on both sides of the heterogeneous zones. Daily measurements of the flowrate (Q) out of the tank and the head drop (dh) across the sand (dl) will make determination of the hydraulic conductivity (K) possible using Darcy’s Law. Other ports will be used to collect aqueous samples of about 1-3 mL for analysis of propylene glycol, nitrogen, and/or tracer chemicals such as bromide. Effluent from the tank will be collected and analyzed to determine pH, as well as biomass amounts, which will be measured as volatile suspended solids.
Propylene glycol, a primary component in aircraft de-icing fluid will be used as a readily biodegradable carbon source for these observations. The propylene glycol will be added to the influent using a peristaltic pump just before the inlet manifold to minimize bacterial growth in the feed tank, tubing, and constant head apparatus. The majority of the water fed into the tank will be a simulated groundwater. Carbon degrading bacteria will be enriched from soil obtained from the Denver International Airport and mixed at a low concentration (<0.1mg VS/g dry weight sand) with the sand before the tank is wet packed. Periodically tracers will be injected into the tank to show water transport. Food coloring and bromide will be used, their response with be tracked through chemical analysis of water samples and /or using a digital camera.
At the end period of microbial growth and related clogging, the contents of the tank will be sacrificed to observe the distribution of biomass within the sand. The tank sand is pre-burned at 550°C; therefore we know its initial carbon content should be zero. We will use this information along with that of volatile solids to evaluate the total carbon matter. Quantification of bacterial versus extracellular substances (EPS) may also be necessary; we will do so using protein and polysaccharide analysis.
Hypothesis and Anticipated Results
The observations made during this experiment will examine the suggestion that growth of biomass does affect the fate and transport of contaminates under in situ bioremediation conditions. Observations and data will help assess the head drop from tank end to end with clean sand as well as through out the experiment. This should show an increased head drop within the tank as the experiment progresses and biomass growth is able to occur. Also effluent as well as mid tank samples will be tested in order to determine propylene glycol concentrations at these points. This should show low concentrations at the beginning of the experiment and an increase to a point of stabilization in concentrations as the experiment progresses, proving that biomass growth is prolonging propylene glycol degradation. Biomass growth should be most noticeable near the inlet and the top of the tank where propylene glycol and oxygen concentrations are highest. The zones of heterogeneity should show that biomass concentrations are highest in the coarser areas due to the increased void space of these areas.
If these anticipated results prove to be accurate this will aid in the understanding of propylene glycol fate and transport within soil, and prove advantageous to aircraft de-icing fluid remediation of sites surrounding runways.
Schedule
Week 1 (June 3-7) - Set up old tank
Week 2 (June 10-14) - Play with old tank, achieve constant flow, order parts, grow
propylene glycol degrading biomass and learn propylene glycol, nitrate, ammonia,
and biomass analysis
Week 3 (June 17-21) - Burn sand from old tank and begin packing new tank, first tracers
Week 4 (June 24-28) - Feed PG into tank, measure K, Sampling, analysis
Week 5 (July 1-5) - Feed PG into tank, measure K, Sampling, analysis
Week 6 (July 8-12) - Feed PG into tank, measure K, Sampling, analysis
Week 7 (July 15-19) - Feed PG into tank, measure K, Sampling, analysis
Week 8 (July 22-26) - Feed PG into tank, measure K, Sampling, analysis
Week 9 (July29- August 2) - Sacrifice and measure final biomass distribution
Week 10 (August 5-9) - Continue interpretation and presentation of research results
Back to top
Summary
We conducted our experiment in a tank measuring 122 cm long, 45 cm high, and 7 cm wide. The tank was filled with #50 sand and included 4 boxes of heterogeneity, 2 coarse sections consisting of #16 sand and 2 fine sections of #70 sand (see diagram 1 in proposal). Gravel was used for increased dispersion of flow before entering and exiting the sand area. The tank was seeded with microbes during packing and was fed a nutrient limited ground water recipe through a constant head apparatus at an optimal rate of 20 mL/min. The ground water recipe consisted of calcium carbonate, sodium bicarbonate, potassium dihydrogen phosphate, dipotassium hydrogen phosphate, magnesium sulfate, ammonium chloride, sodium nitrate, calcium sulfate, ferric chloride, and trace elements. Propylene glycol was fed into the tank using a pump at a rate of .76 mL/min and a concentration of 200mg/L.
Daily flowrate, head, and saturation measurements were used to quantify hydraulic conductivity. Proypylene glycol degradation was monitored by taking daily samples throughout the tank for analysis using a spectrophotometer. Effluent samples were collected once a day, they were then filtered, dried and burned to find biogrowth content. Once a week we pumped potassium bromide and red food coloring into the tank to analyze tank flow and dispersion. The tank was sacrificed and split into 30 sections (4 being of heterogeneity). Samples from each section were tested to find volatile solids and extracellular polymeric substance contents. From this data we were able to estimate microbial versus bio film percentages.
Back to top
Results
(graphs available in presentation)
Hydraulic Conductivity
Conductivity was measured using Darcy's Law Q=K(dh/dl)A. Head measurements were taken at 12 places within the tank, including areas of heterogeneity. Our calculations show anticipated patterns, the conductivities decreased through the experiment especially within the areas of coarse heterogeneity. This was due to the greater void spaces within these areas, which allowed for increased microbial growth. Periodically the inlet gravel would become significantly clogged and we would pull out, clean, and repack the gravel. This did effect the conductivity measurements due to lack of new biogrowth moving through the tank and is the visible spike in the conductivity graphs.
Propylene Glycol Analysis
As we had expected propylene glycol concentrations were decreasing across the tank then beginning to stabilize. The levels started off higher in the front of the tank at around 200 mg/L, which was the feed concentration. Lower concentrations were observed at the end of the tank due to propylene glycol degradation. The stabilizations that occurred later are believed to be a result of bioclogging, however again small spikes in the graph may be due to gravel cleaning which allowed for higher concentrations entering the sand area.
Volatile Suspended Solids
Through the collection, filtration, and burning of effluent tank water we were able to see trends in biogrowth leaving the tank. Biomass concentrations increased as the time progressed. Some decreases did occur, though they were also thought to be due to unclogging of the gravel. When cleanings occurred lower biomass concentrations would have been entering and passing through the tank into the effluent.
Bromide Analysis
During bromide tracer tests rapid movement was observed through coarse areas, and slower movement through the fines. Later experiments showed slower movement through the coarse boxes confirming beliefs that bioclogging would occur more rapidly given greater void spaces.
Volatile Solids
Analysis of tank sand during unpacking did confirm greater biogrowth in the coarse box closest to the top of the tank. This box had received more oxygen during the experiment; however the fines box closest to the top also revealed a small spike in biomass concentration. This may be due to biogrowth shearing from the coarse area that may have been unable to pass through the following fines section. Areas of the tank closest to the bottom did show less signs of microbial growth due to their location and lack of oxygen. Of the biogrowth in the tank 75-90% of the mass was found to be bacteria.
Extracellular Polymeric Substances
Biofilm was found in low concentrations thought out the tank. Roughly 10-25% of biomass was biofilm. No other apparent trends were visible.
Back to top
References
Bielefeldt, A., 10 June 2002, “Personal Communication.”
Bielefeldt, A., McEachern, C., Butler, T., Illangasekare, T., Effect of Biogrowth In
Saturated Sand on Groundwater Flow in a Two-Dimensional System. Draft.
Butler, Tamara. 1999. Effect of Propylene Glycol Induced Biogrowth on Hydraulic
Conductivity and Dispersivity of a Two-Dimensional Homogeneous Porous Media.
Non-Thesis Report.
Compos,R., Jr. 1998. Multiple experimental realizations of dense nonaqueous phase
liquid spreading in water-saturated heterogeneous porous media. M.S. Thesis.
University of Colorado
Mallinckrodt Baker, Inc., “Propylene Glycol.” Materials Safety Data Sheet. 02 October
2001. Available from http:/www.mallchem.com/msds/p6928.htm. Internet. Accessed
10 June 2002.