|
1
|
|
|
2
|
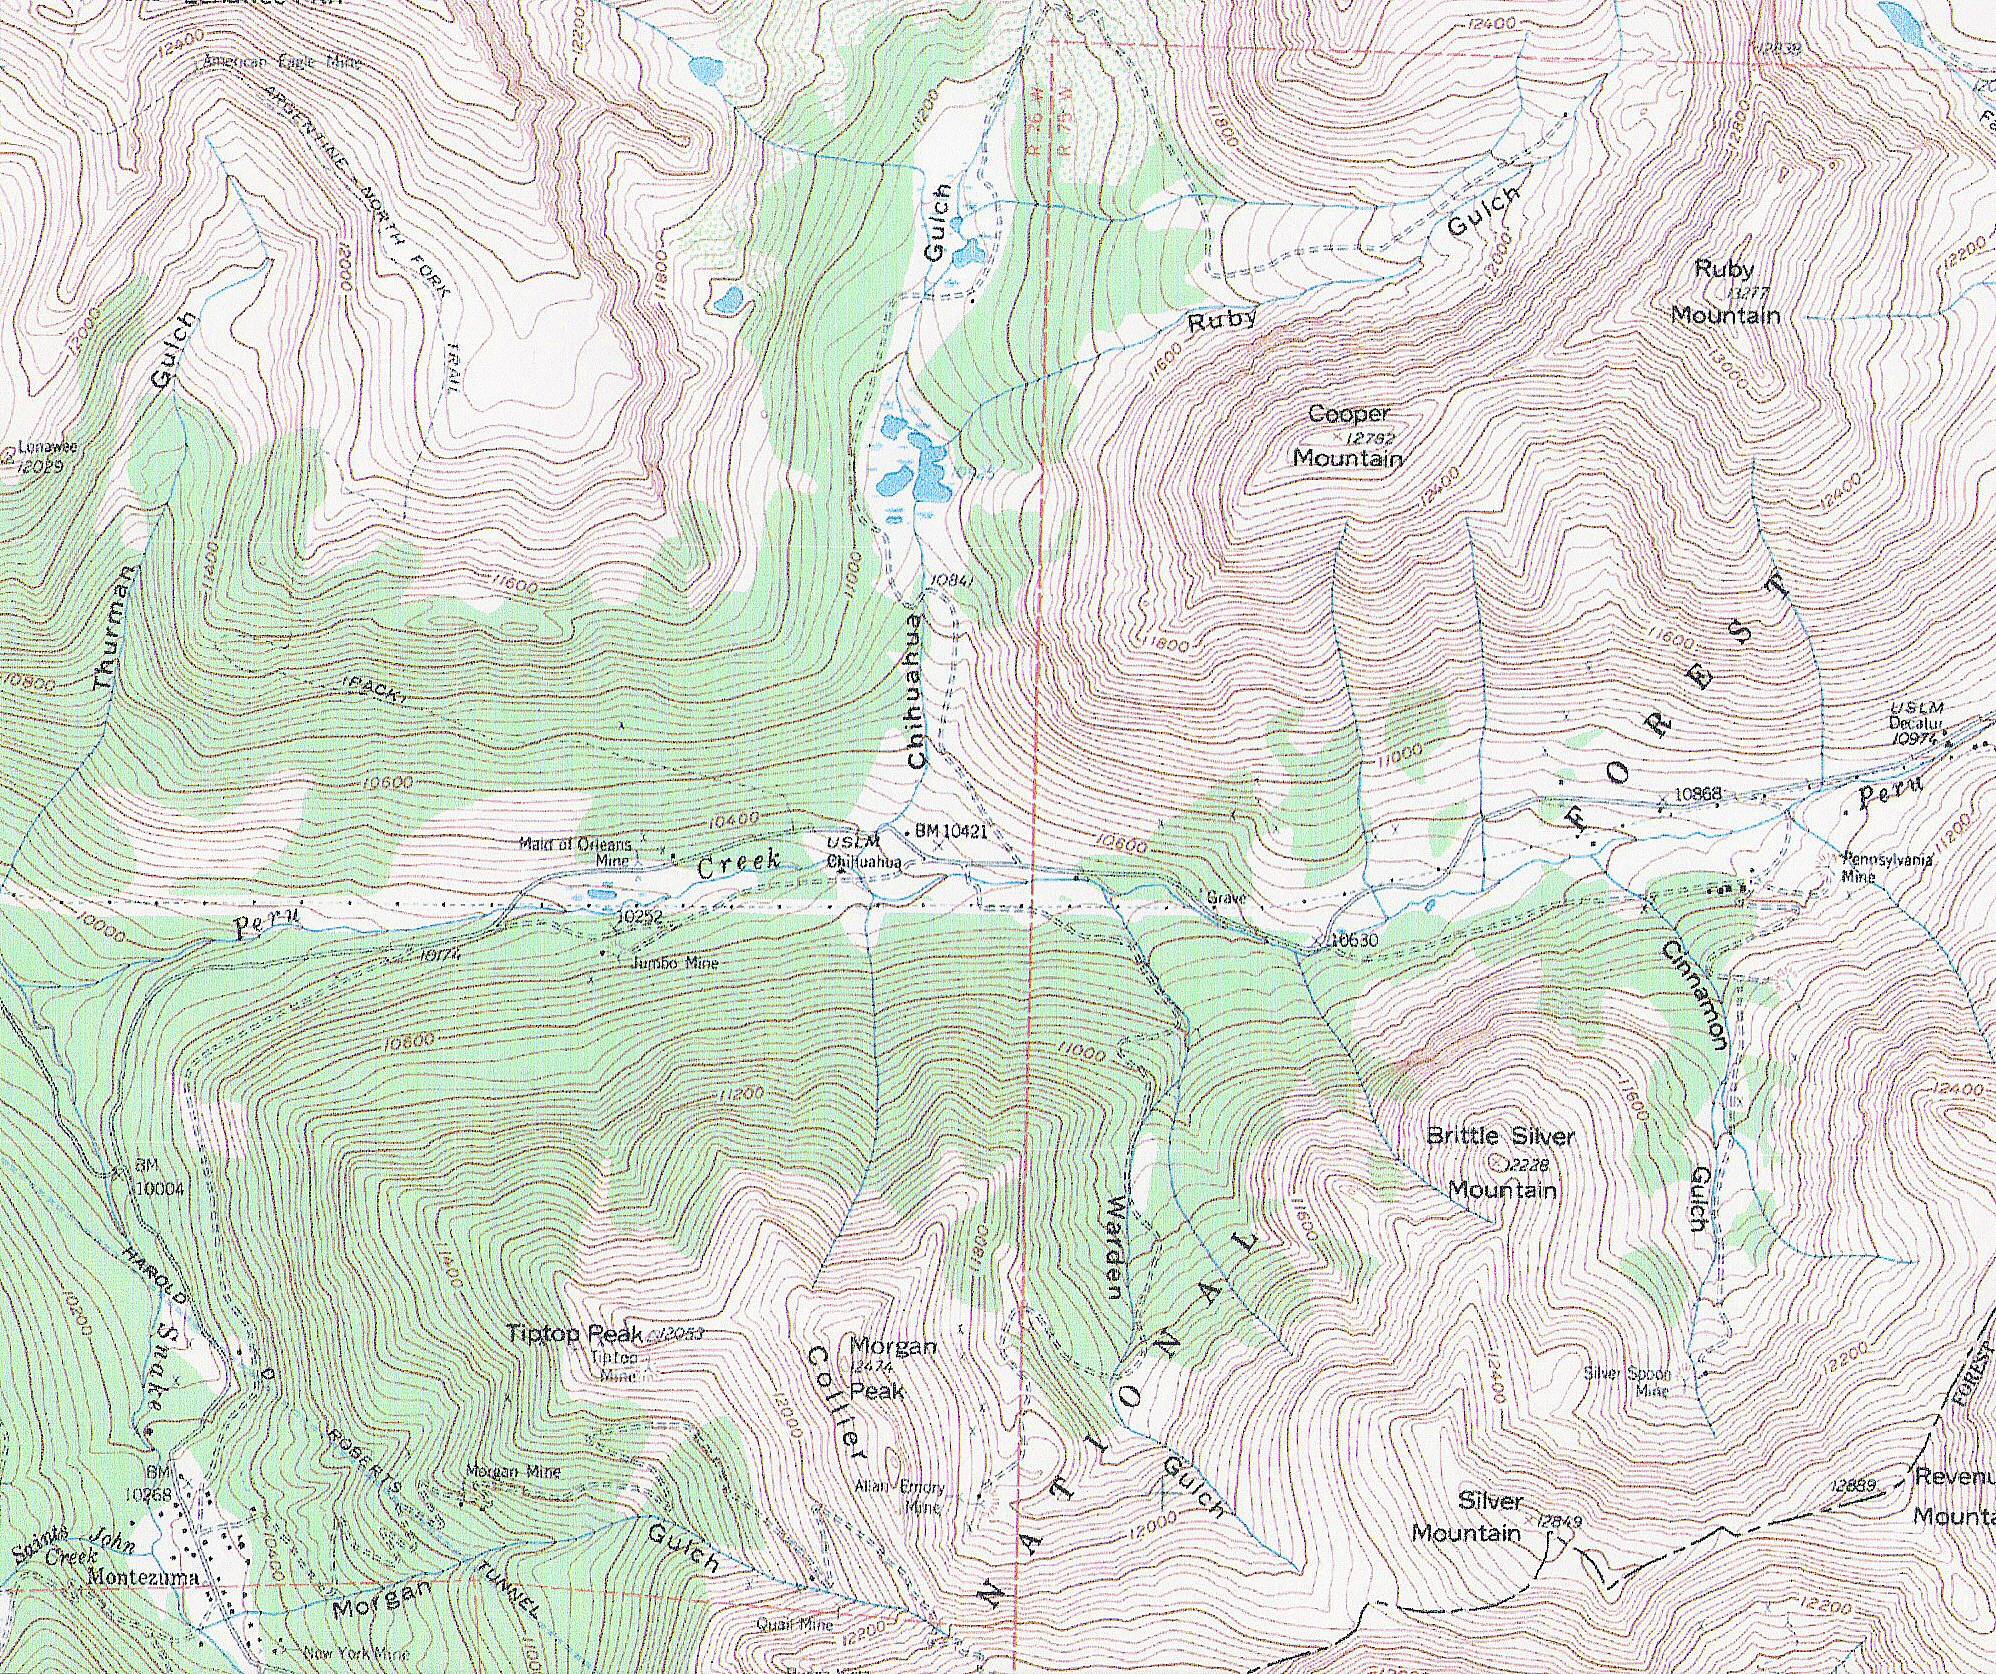
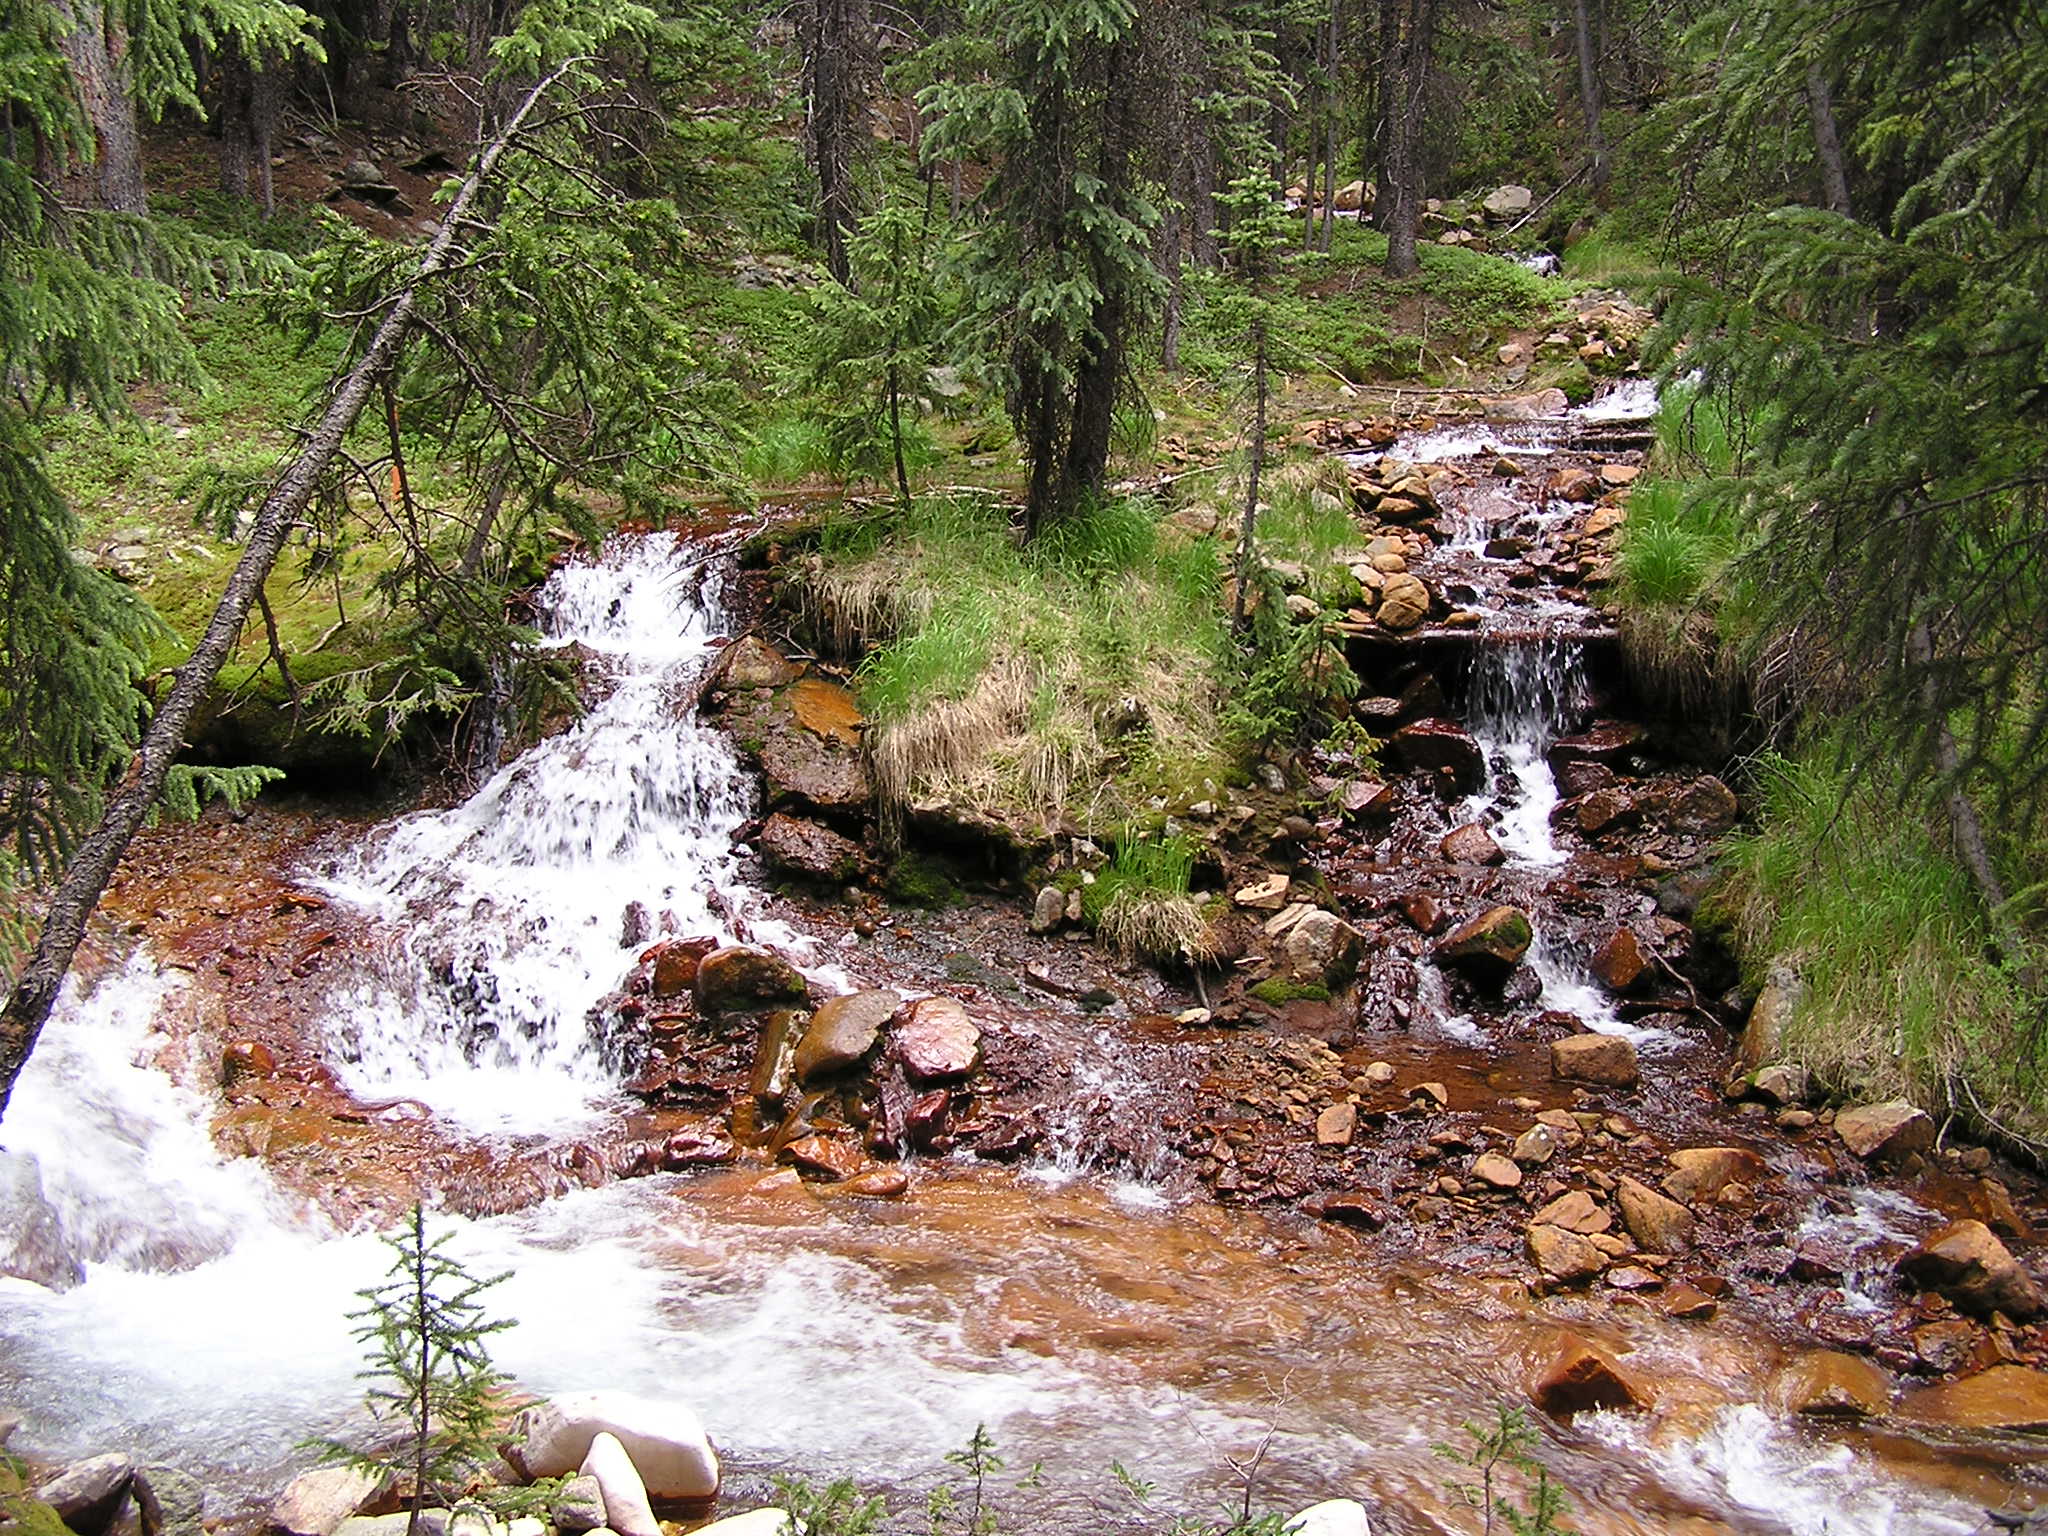
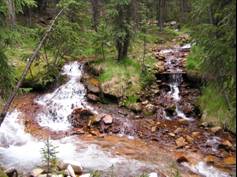
- Summit County, Colorado.
- Near Keystone Ski Resort
- 8km in length and feeds into the Snake River.
- About 27-51% of total flow for the Snake River.
- Many mining catchments located within the watershed.
- Elevation about 10,500ft.
|
|
3
|
|
|
4
|
- For remediation of Peru Creek it is imperative to locate the major
sources of contamination.
- Money has already been spent to clean up around Pennsylvania Mine.
- Pennsylvania Mine found to be one of the smaller contributors of
contamination.
|
|
5
|
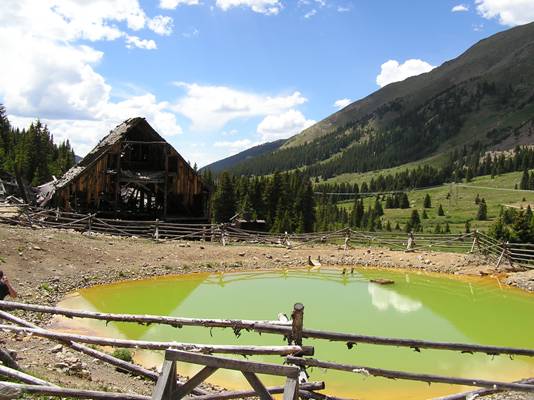
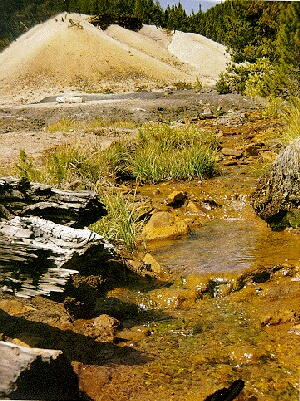
- Caused by mines.
- Process called Acid Rock Drainage (ARD).
- Over 1900km of streams, rivers and lakes, in Colorado, are affected by
ARD.
|
|
6
|
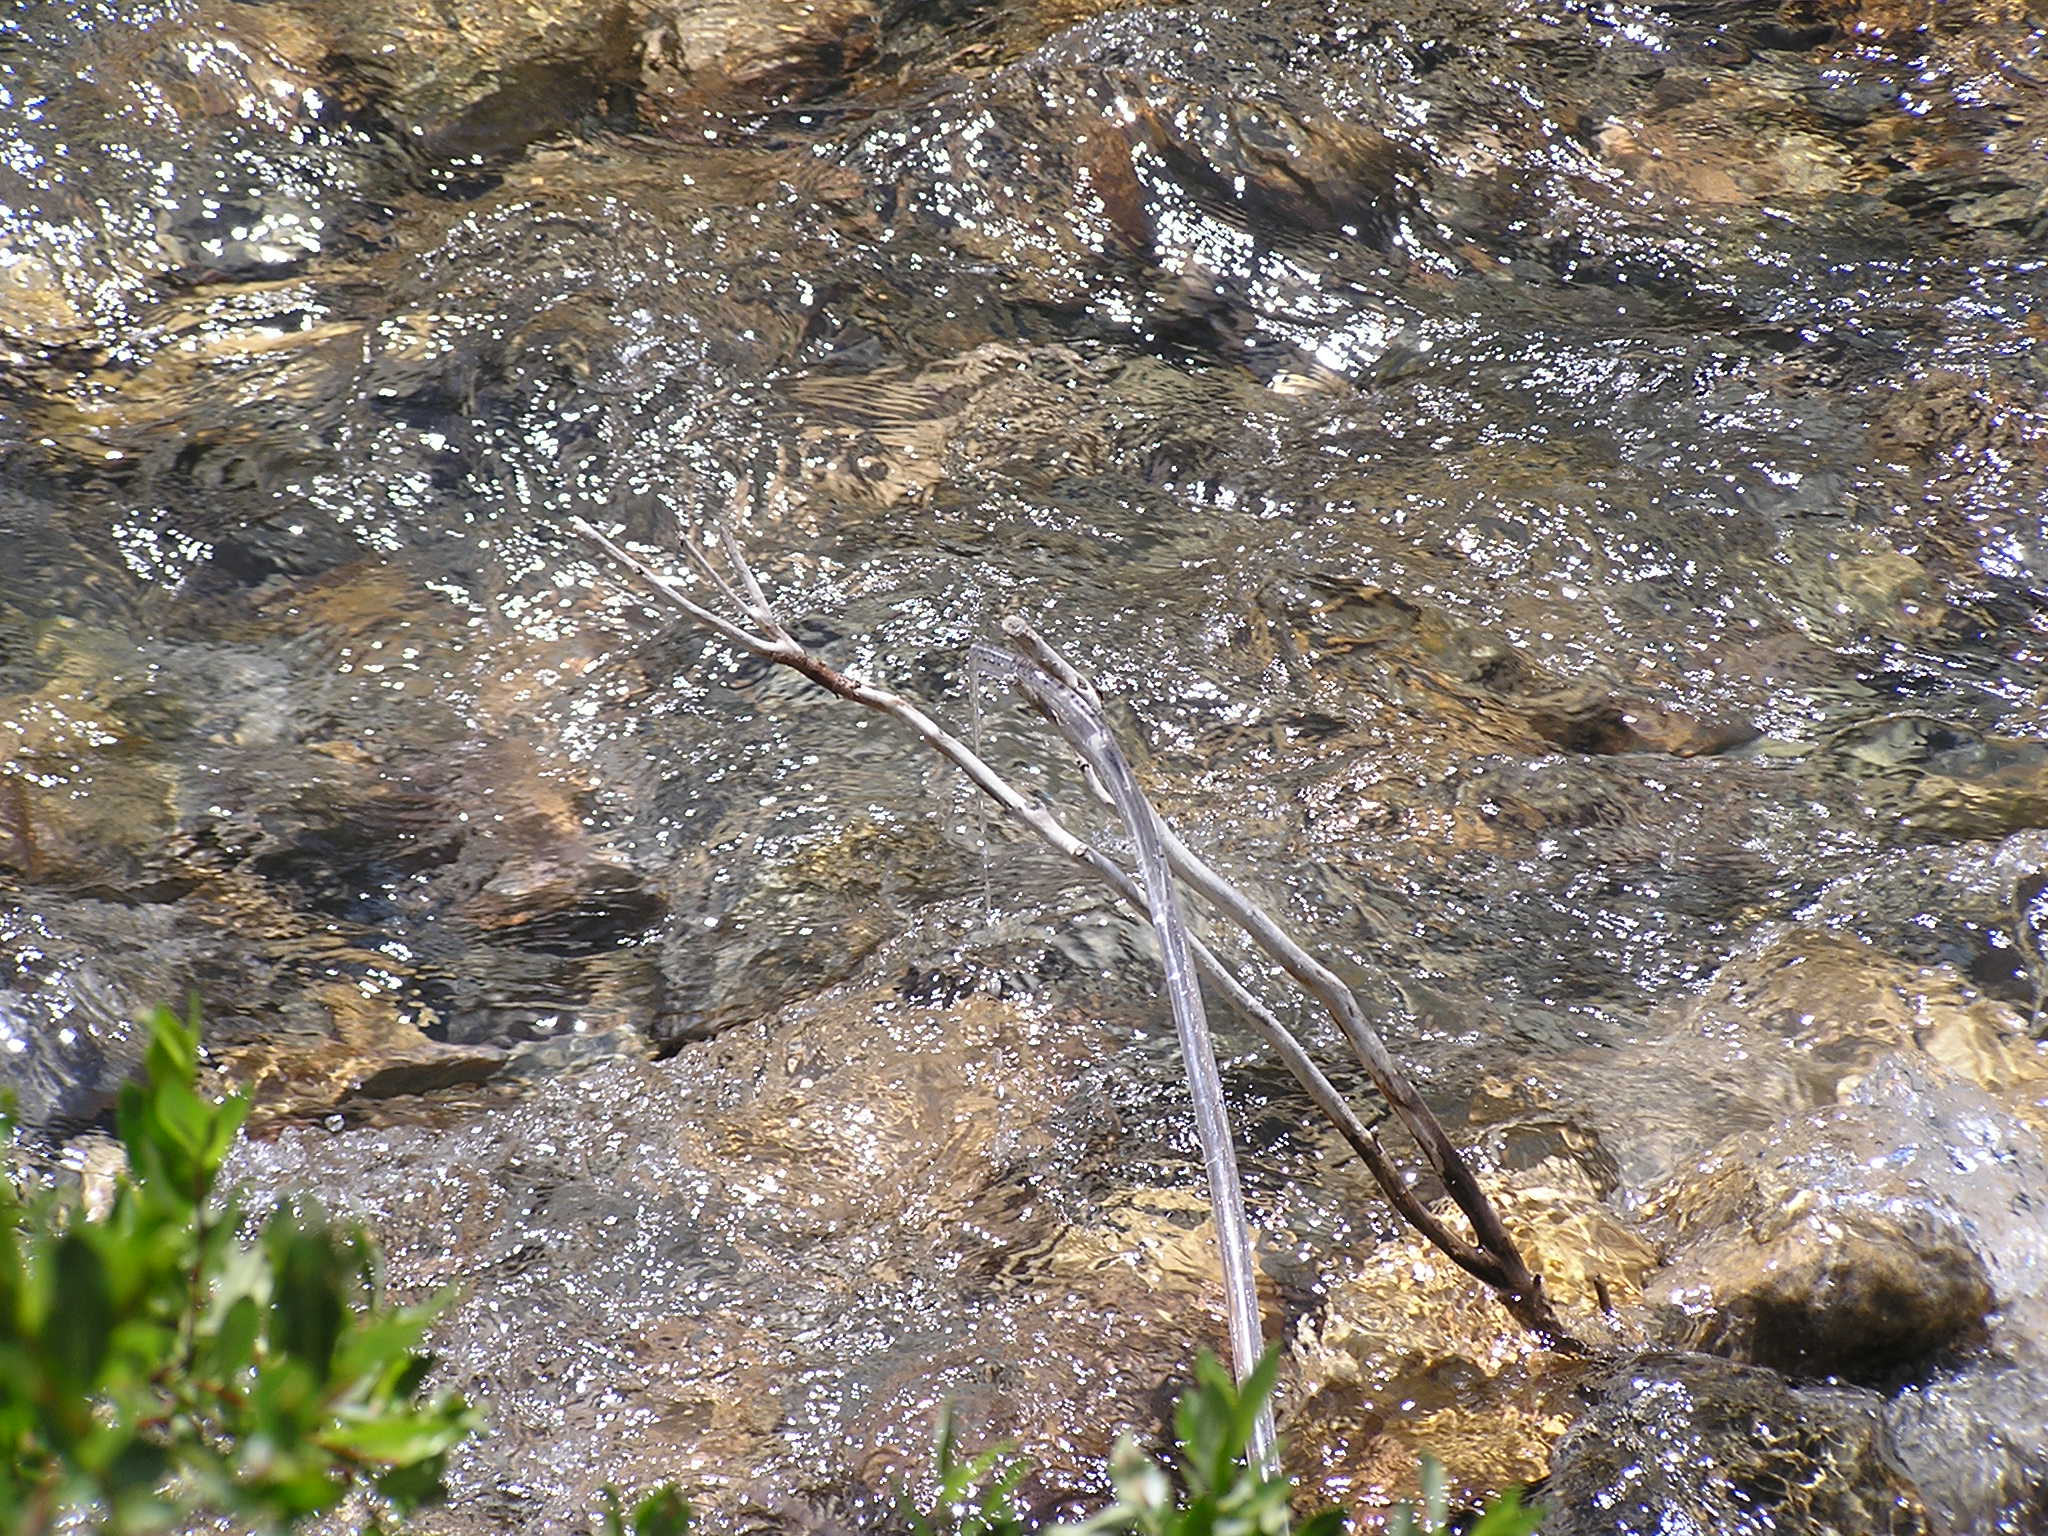
- Atmospheric oxidation of iron-sulfur minerals (FeS2).
- Minerals usually isolated from the atmosphere, come in contact with
atmosphere.
- Runoff from tailings piles and drainage from adits are highly acidic and
highly concentrated with metals.
|
|
7
|
- 1) 2 FeS2 + 7 O2 + 2 H2O = 2 Fe2+
+ 4 SO42- + 4 H+
- Pyrite + Oxygen + Water = Ferrous Iron + Sulfate + Acidity
- 2) 4 Fe2+ + O2 + 4 H+ = 4 Fe3+
+ 2 H2O
- Ferrous Iron + Oxygen + Acidity = Ferric Iron + Water
- 3) 4 Fe3+ + 12 H2O = 4 Fe(OH)3 ¯ + 12 H+
- Ferric Iron + Water = Ferric Hydroxide + Acidity
- 4) FeS2 + 14 Fe3+ + 8 H2O = 15 Fe 2+
+ 2 SO42- + 16 H+
- Pyrite + Ferric Iron + Water = Ferrous Iron + Sulfate + Acidity
|
|
8
|
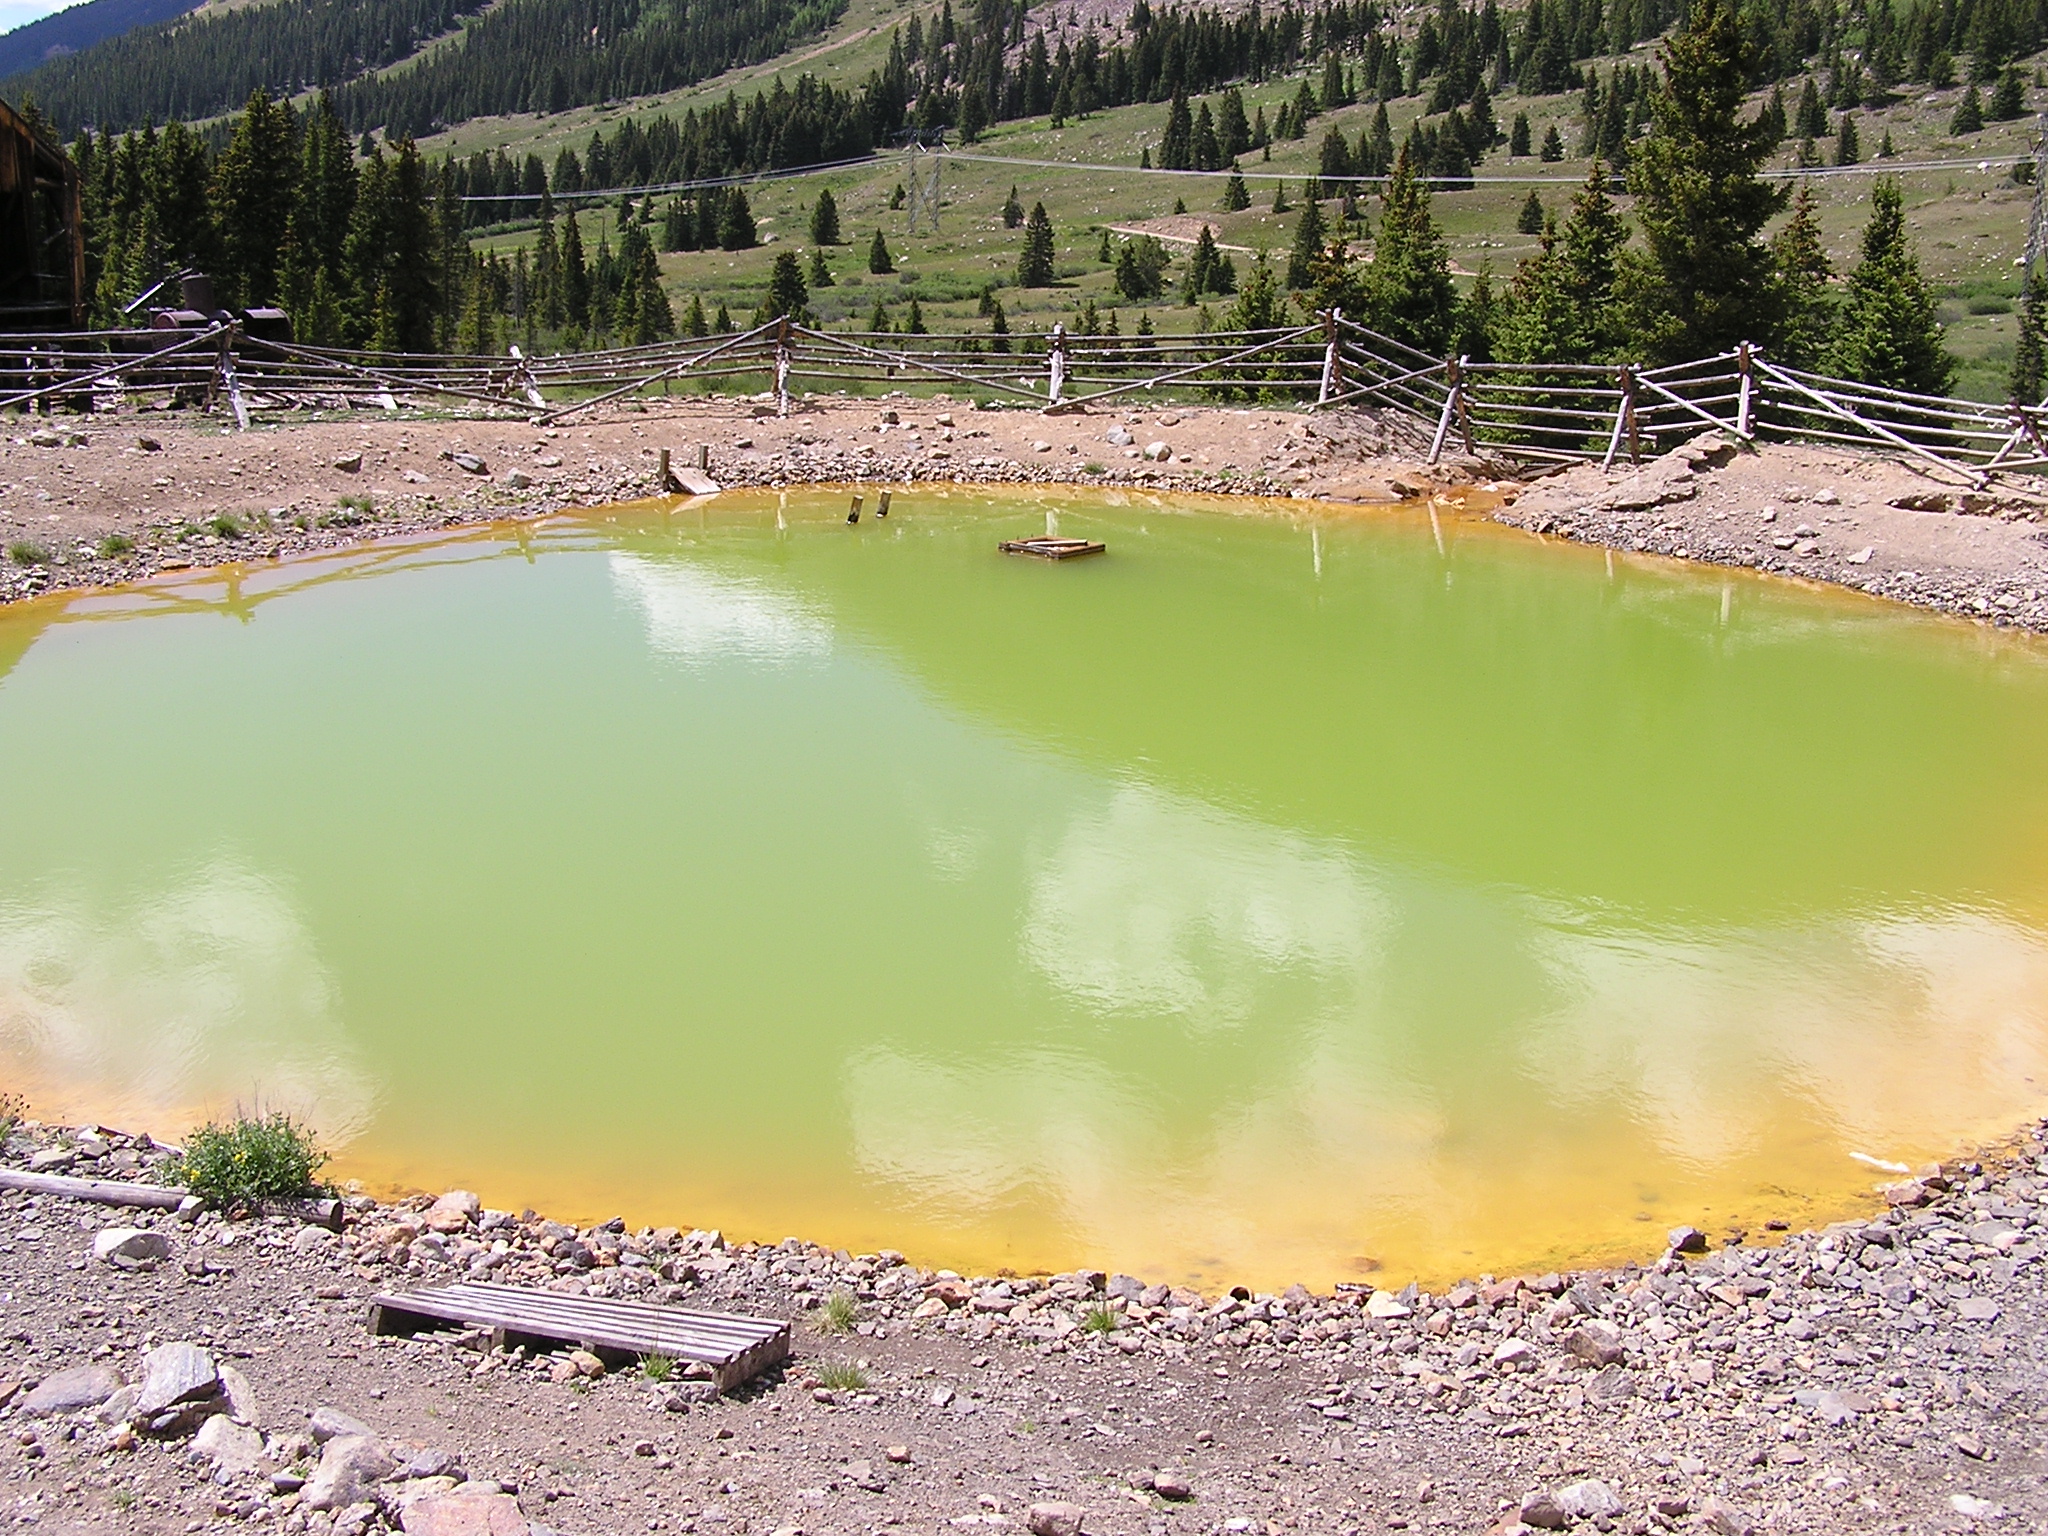
- Lowered pH in the tailings and adits leads to and increase in dissolved
metals.
- Mixes with the receiving waters creating a lowered pH and higher metal
concentrations.
- Low enough pH and high enough metal concentration kills aquatic life.
|
|
9
|
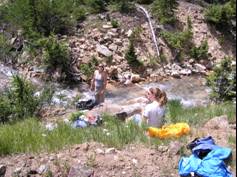
- Sabre Duren’s Master thesis.
- Tracer coupled with synoptic sampling.
- Covered 7 km stretch of Peru Creek.
- Attempted to locate the major area of metal loading along Peru Creek.
- Took place August of 2002.
|
|
10
|
|
|
11
|
|
|
12
|
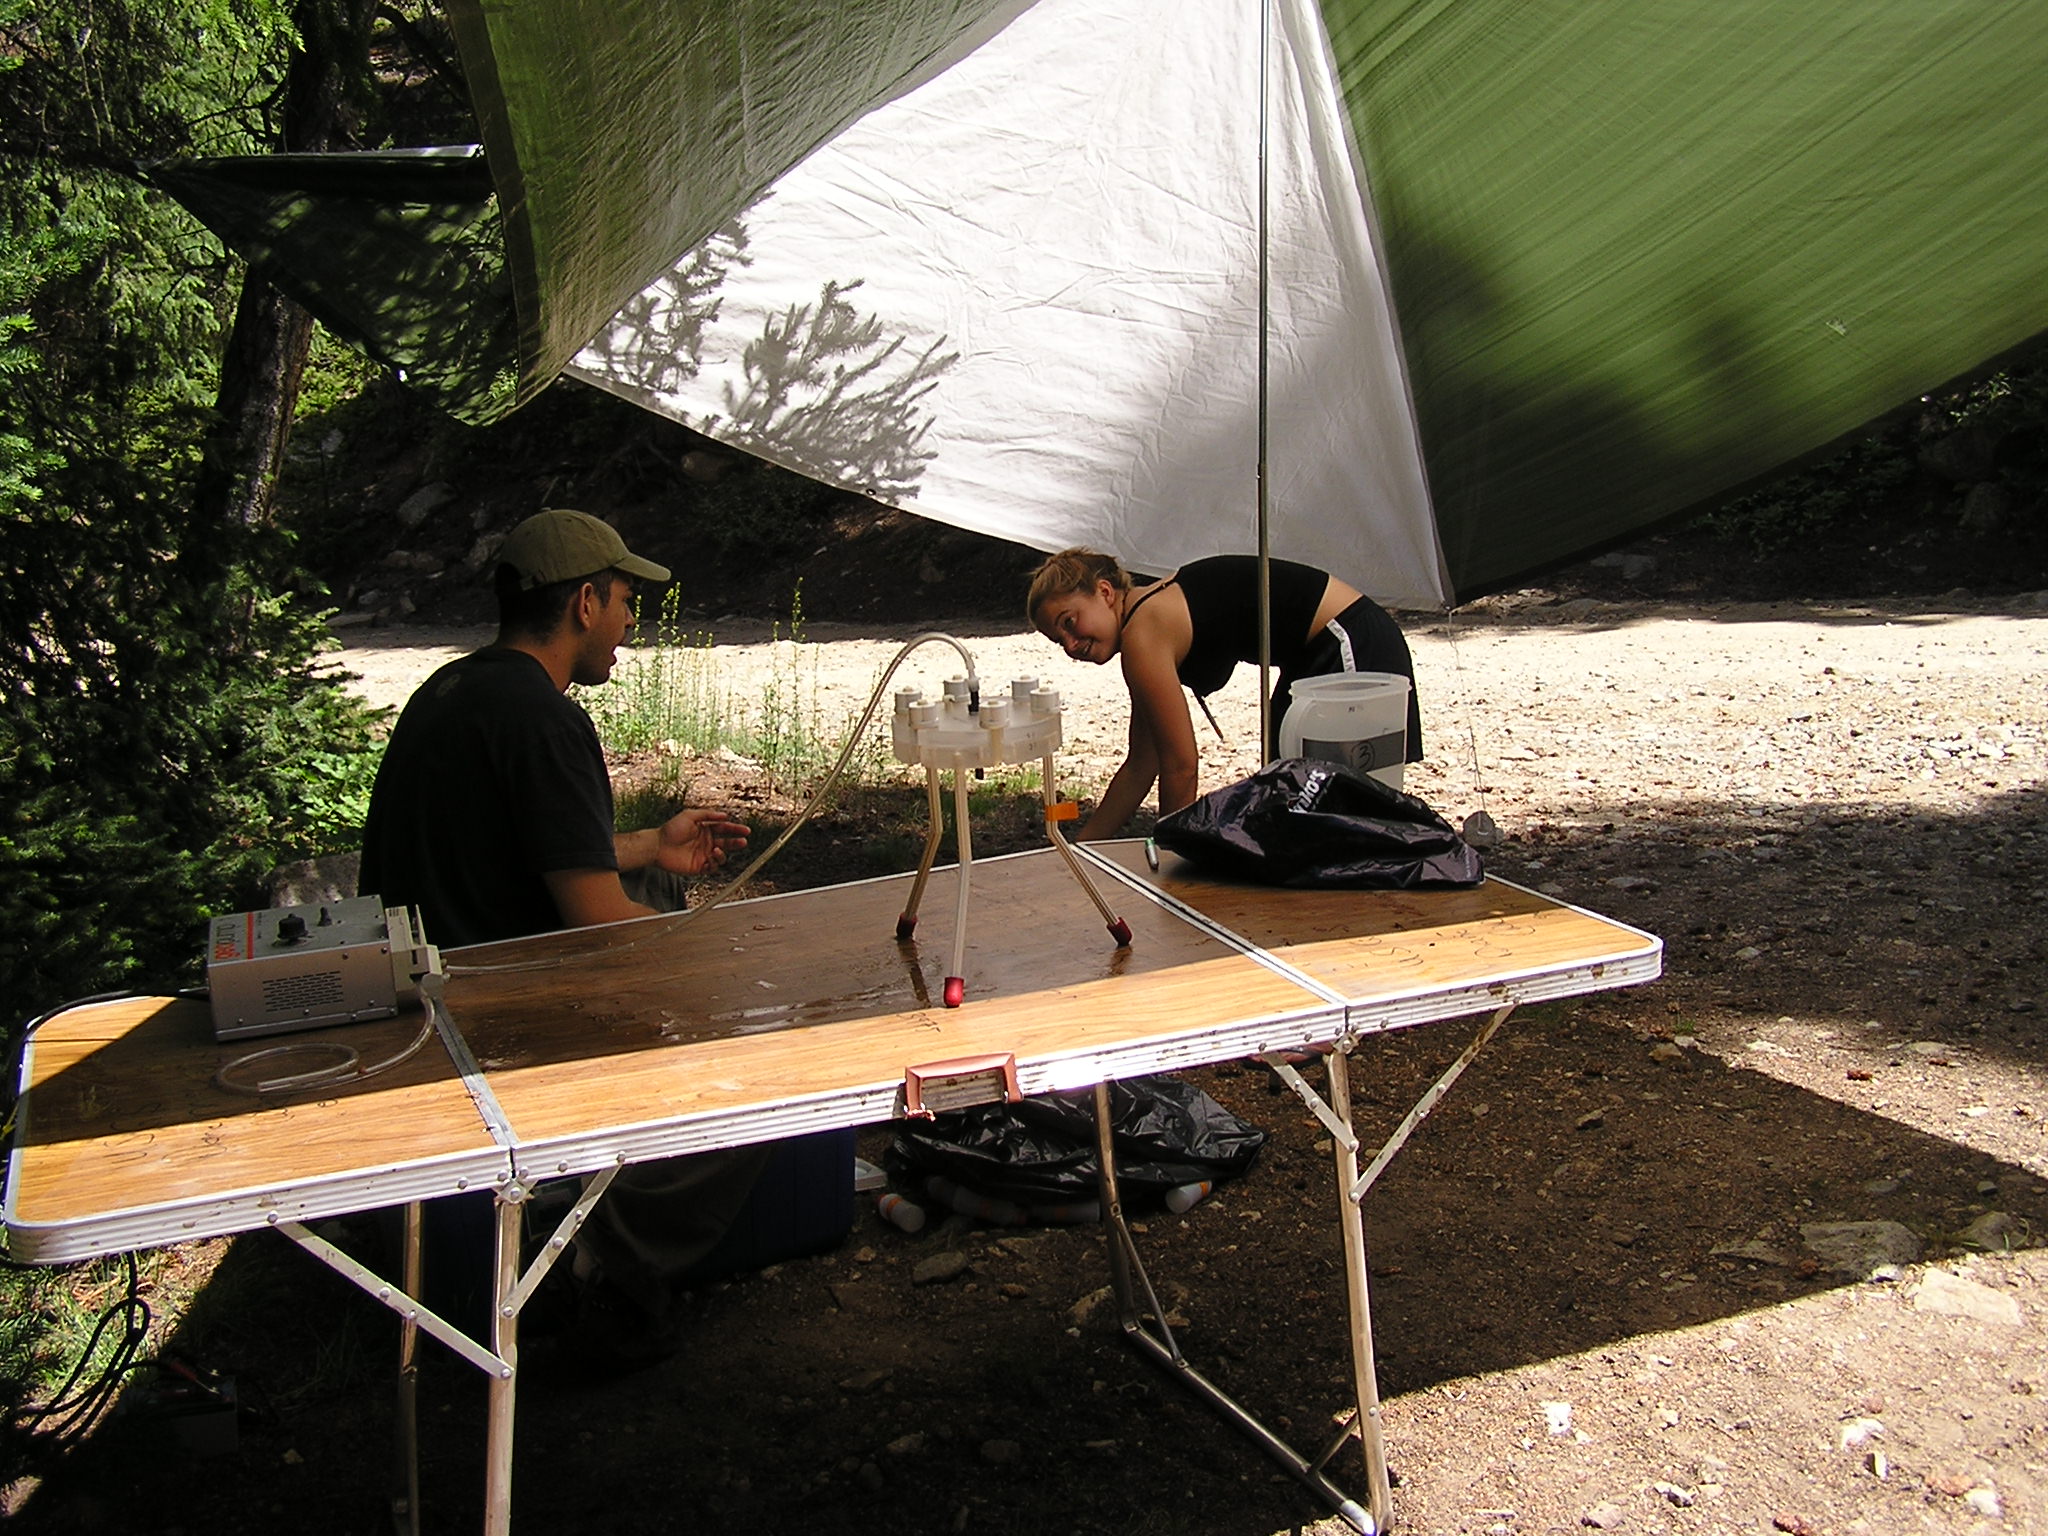
- Tracer experiment coupled with synoptic sampling.
- 6 sampling sites from below the wetlands to just below Warden Gulch.
- From injection point to site #6, 1.3km.
- Injection lasted 3 hours, from 10:45-13:45.
|
|
13
|
|
|
14
|
- Took place July 10, 2004.
- LiCl used as the conservative substance.
- Sampled for Fe, Zn, Li, Cl, DOC.
- Flow, pH, conductivity, and temperature were taken on site.
|
|
15
|
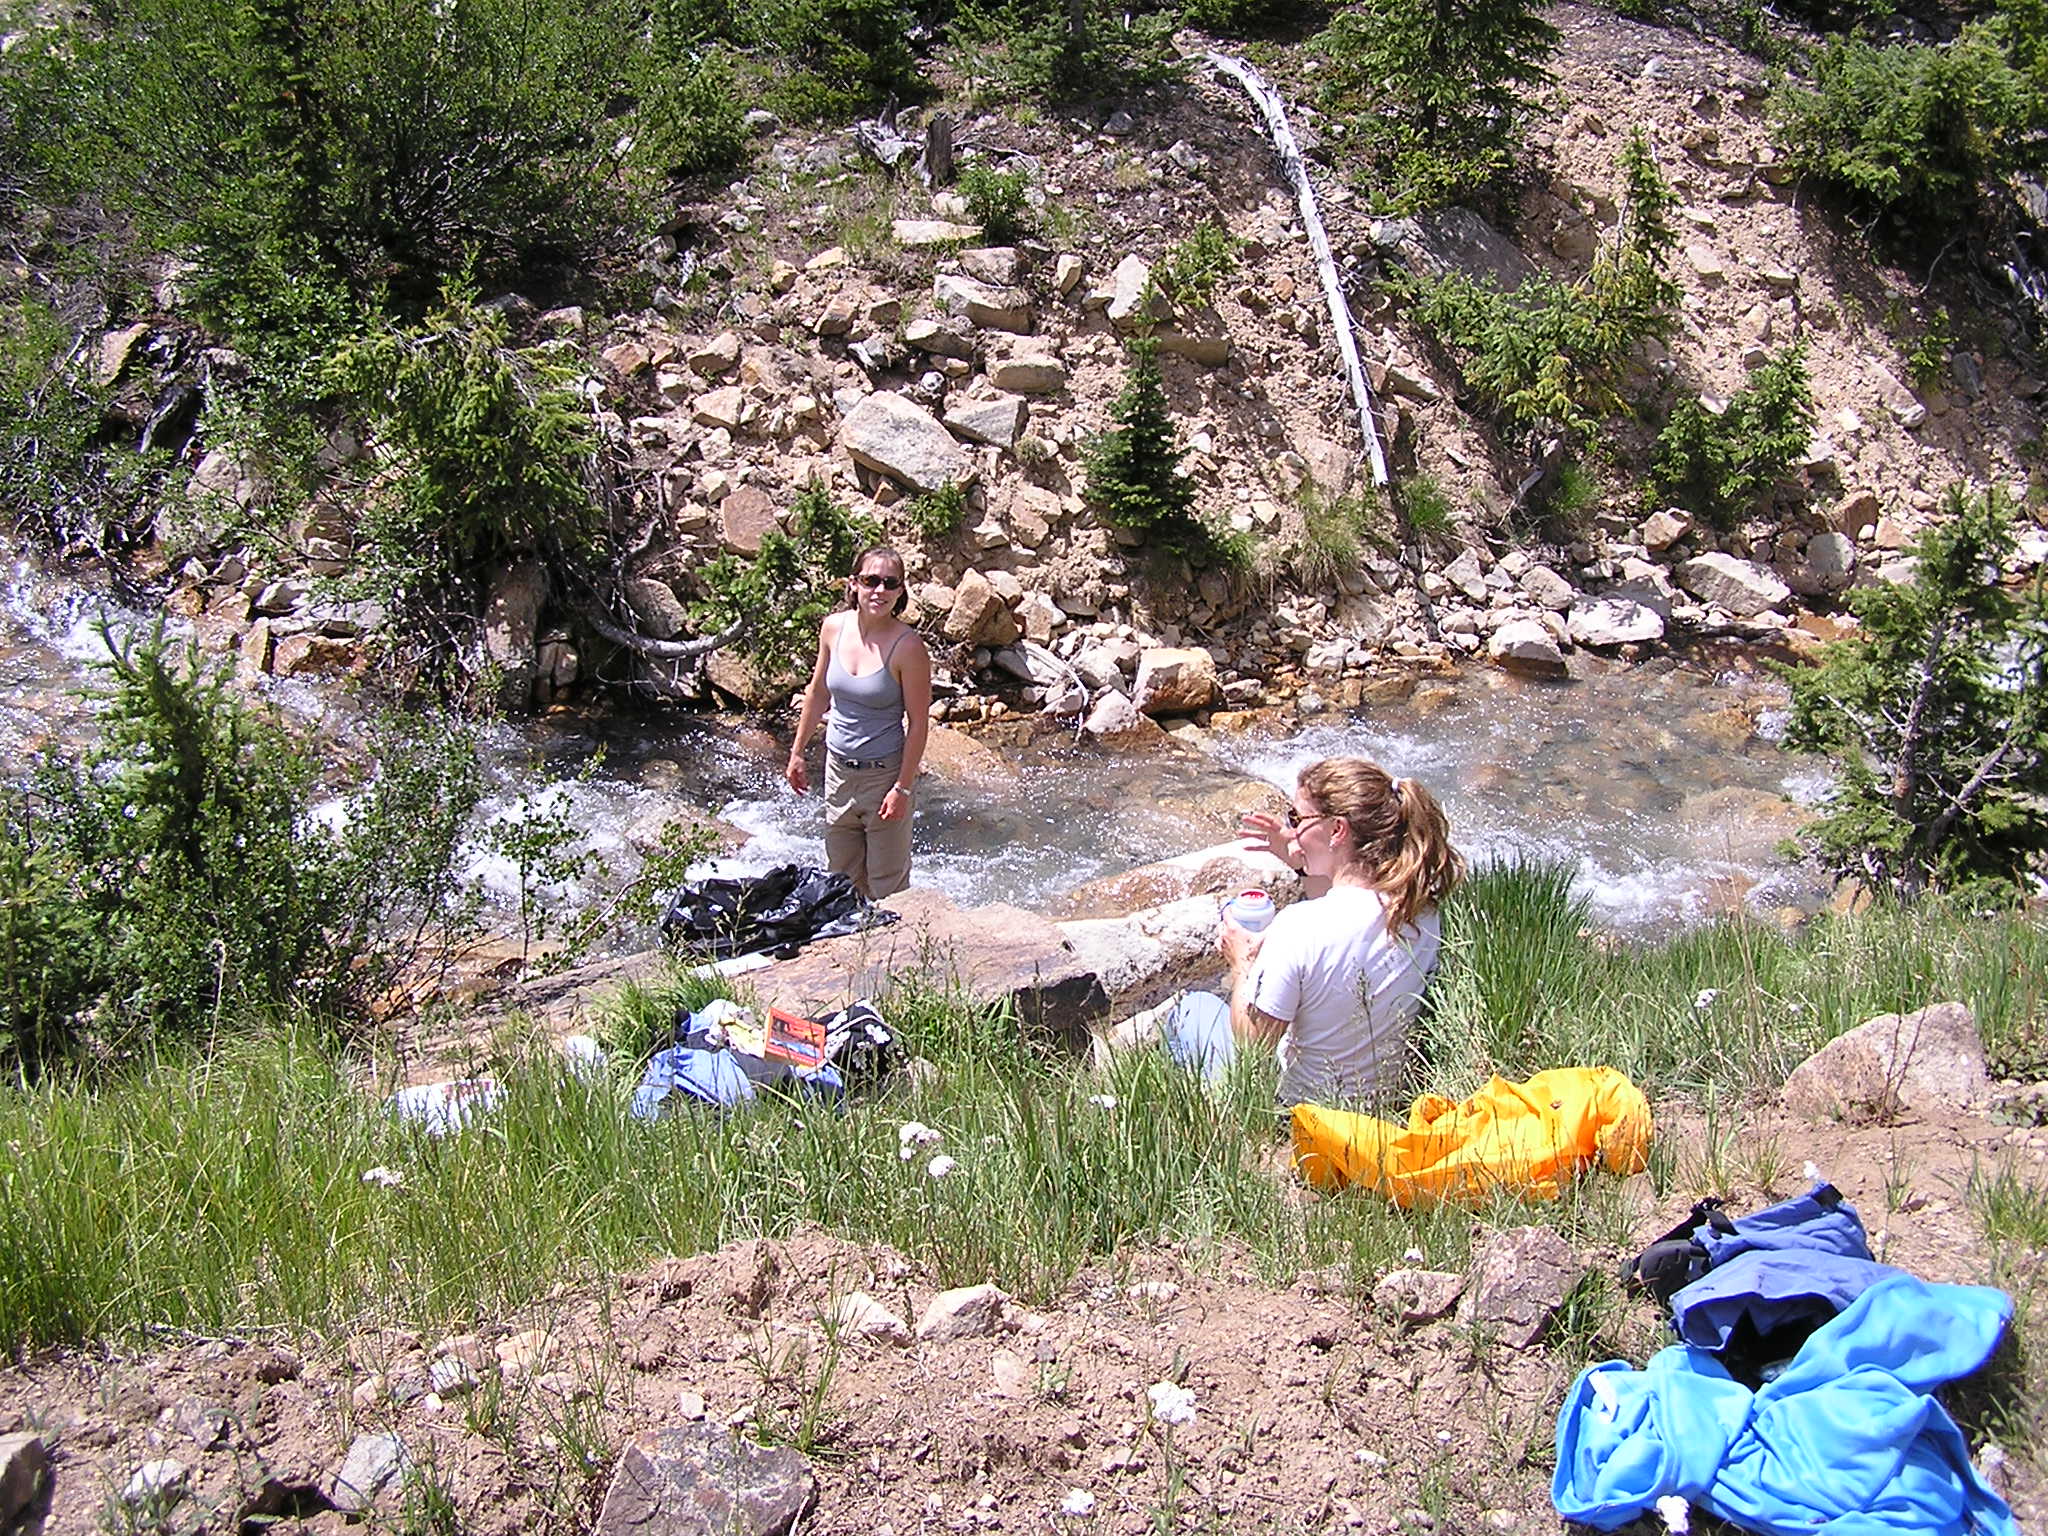
- Samples
- Li, taken directly from stream every 5 minutes during rising and
falling limbs, and every 15 in-between.
- Fe, Zn, and Cl, taken every half hour and filtered.
- DOC, taken every hour.
|
|
16
|
- Readings
- Flow, taken at beginning and end of experiment with pygmy meter.
- pH, Conductivity, and Temperature, taken throughout the day with
hand-held pH/Conductivity probe.
|
|
17
|
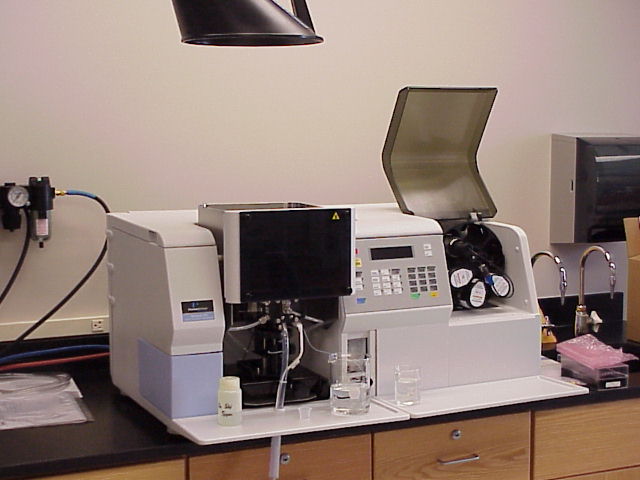
- Li and Zn; Atomic Absorption
Spectrometer.
- Fe; UV Vis.
- DOC; Total Organic Carbon
Analyzer.
- Cl; Ion Chromatograph.
|
|
18
|
- Li Flow
- Inj. Rate (L/s) * Inj. Li Conc. (mg/L) = Set Flux (mg/s)
- Set Flux (mg/s) / Site’s Avg. Plateau Li Conc. (mg/L) = Site’s Flow
(L/s)
- Fe / Zn Flux
- Site’s Flow (L/s) * Site’s Fe or Zn Conc. (mg/L)
- = Site’s Fe or Zn Flux (mg/s)
|
|
19
|
- % Loading From Sites 1-6
- (Site’s Flux (mg/s) / Sum of Flux for Sites 1-6 (mg/s)) *100
- = % Loading From Sites 1-6
- If sites Flux <0, then it was not considered for loading
calculations.
- % Loading For Entire Stream
- % Loading From Sites 1-6 * August 2002 values of Loading for the Warden
Gulch Reach = % Loading For Entire Stream
|
|
20
|
- An inflow between sites 2 and 3 was found to be a major cause of the
metal loading and pH drop associated with this stretch of Peru Creek.
|
|
21
|
|
|
22
|
|
|
23
|
|
|
24
|
|
|
25
|
|
|
26
|
|
|
27
|
|
|
28
|
|
|
29
|
|
|
30
|
|
|
31
|
|
|
32
|
|
|
33
|
- Inflow, major source of contamination.
Better place for remediation to occur.
- Between Sites 2 and 3, there is also some unaccounted flux of Fe and
Zn. Possibly due to ground water
inflow.
- Between Sites 1 and 2, there is a high loading of Fe. Possibly due to
ground water inflow.
- If Sites 1-4 cleaned up, about 70% of Fe and 40% of Zn loading could be
dealt with.
|
|
34
|
- Advisor: Diane McKnight
- Grad Students: Marcie Appel
- Chris
Jaros
- Sabre
Duren
- REU participants (plus Pete)
- Math/Bio program
|
|
35
|
- Interstate Mining Compact Commission (IMCC), 1992. Inactive and
Abandoned Non-Coal Mines: a Scoping Study. Prepared for IMCC of Herndon,
VA by Resource Management Associates, Clancy, MT. Cooperative Agreement,
X-817900-01-0.
- Duren, S., 2002. Quantitative Hydrologic Evaluation of Dissolves Metal
Loading and Transport in Peru Creek, an Acid Rock Drainage Stream;
Summit County, Colorado. University of Colorado at Boulder, p130.
|
|
36
|
|

 Notes
Notes