|
1
|
- Friday, August 6th
- Heather Wright
- 4th Year Undergraduate, Michigan Technological University
- Advisors:
- Angela Bielefeldt
- Scott Summers
|
|
2
|
- Background
- Objectives
- Methodology
- Results
- Conclusions
- Future Work
|
|
3
|
|
|
4
|
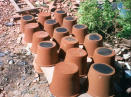
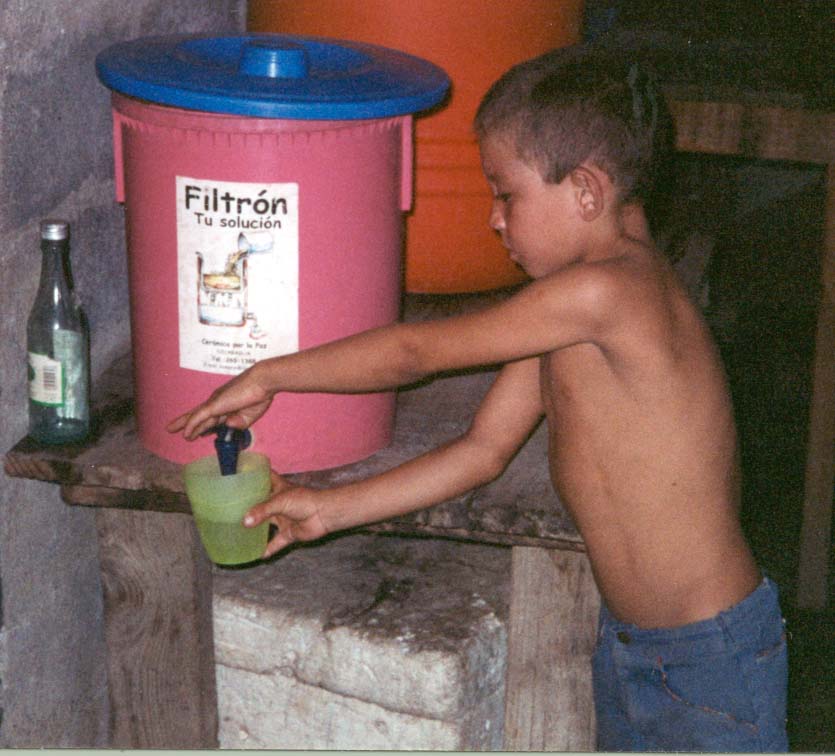
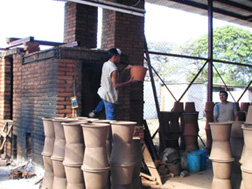
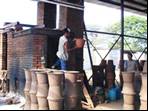
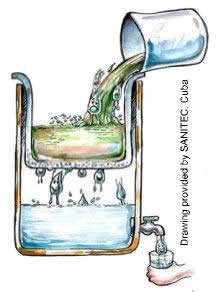
- Ceramic filter made locally from clay and sawdust with a colloidal
silver coating
- Works by mechanical filtering and potentially bacterial inactivation by
the colloidal silver
- Sole criterion that filter must meet: filtration rate between 1-2 L/hr
- Silver concentration applied to filter less than amount that causes
argyria (deposition of silver salts in the skin from excessive
oral intake)
|
|
5
|
- Determine how certain environmental conditions impact disinfection of
colloidal silver
- Determine inactivation ability of colloidal silver compared to silver
ions and “small” colloidal silver
|
|
6
|
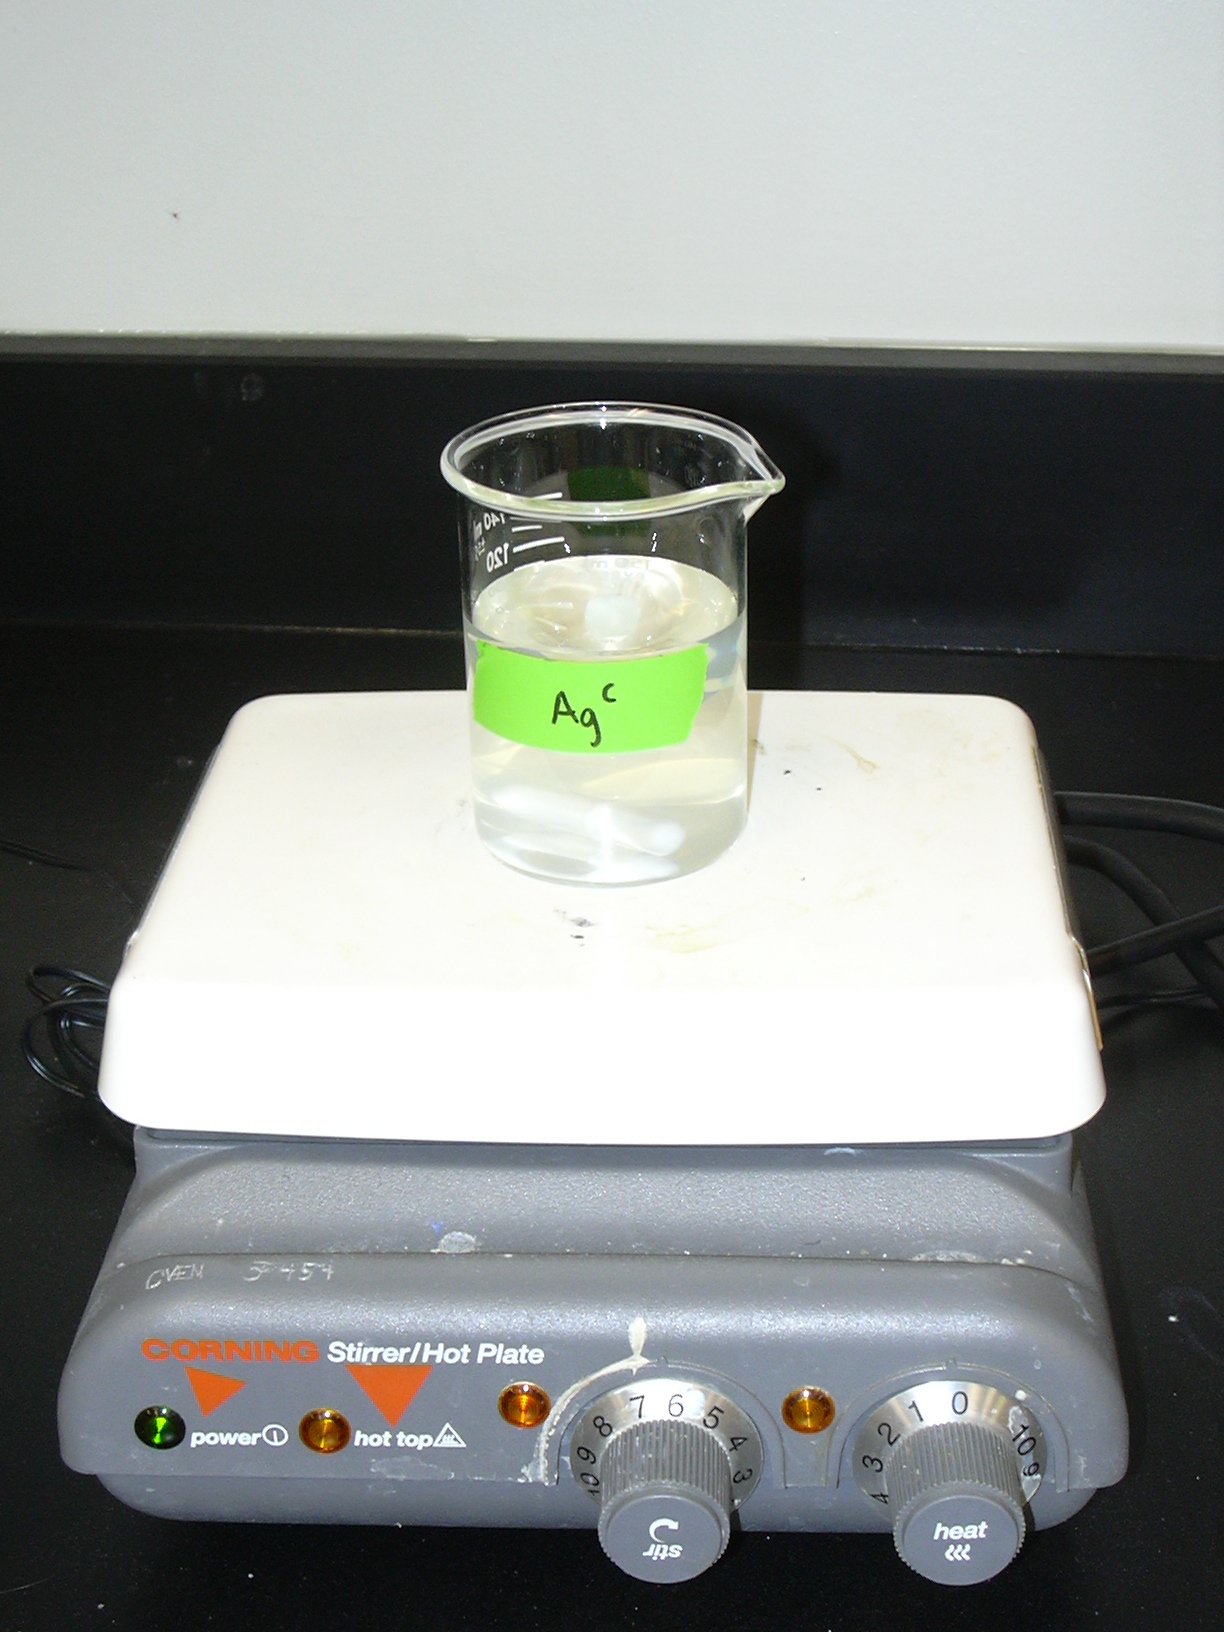
- Effectiveness of colloidal silver tested using fecal coliform in
solution with de-chlorinated tap water
- Bacteria started from Boulder wastewater, grown in media at elevated
temperature and absorbance measured using a spectrophotometer to roughly
determine concentration
- Different parameters (pH or silver concentration) were varied for each
experiment
- Parameters selected to represent conditions that have been reported for
Filtron field users
|
|
7
|
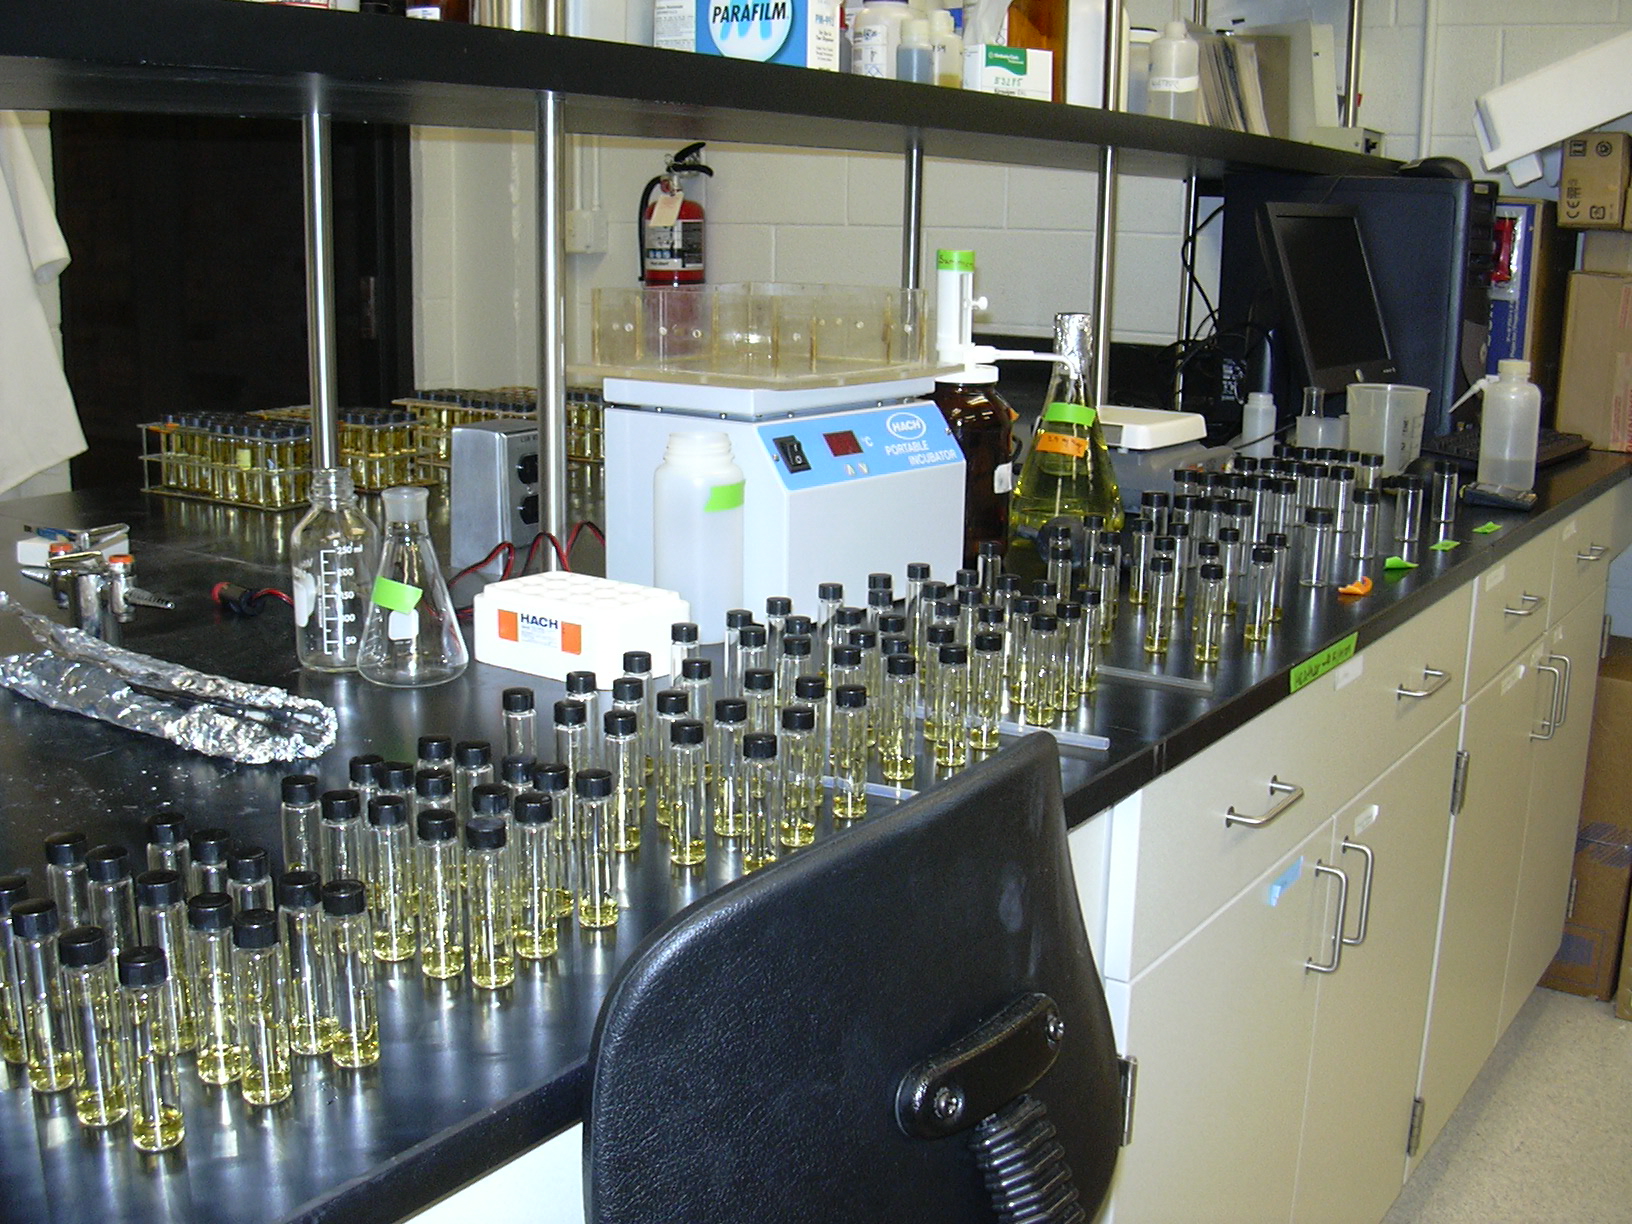
- Performed batch tests
- Quantified fecal bacteria
- concentrations using the
- most-probable number (MPN)
technique
- First two sets of experiments used 6 time points, last set used 2 time
points
- More time points to calculate an inactivation rate constant
- Each time point had 3 dilutions (1,000x, 10,000x, and 100,000x)
- Each dilution had 5 replicates
|
|
8
|
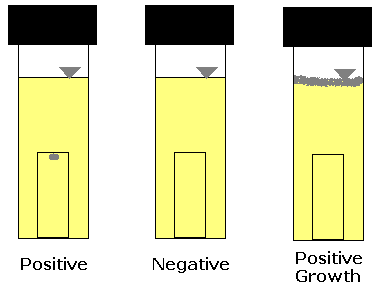
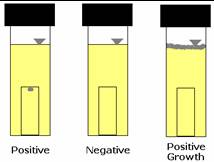
- A-1 broth used for direct isolation of fecal coliforms (Std Methods)
- Once inoculated, vials are incubated for 3 hours at 35oC than
transferred to 44.5oC incubator for 21 hours
- Gas production in any vial indicates a positive result and the presence
of fecal coliforms
- Bacterial growth or turbidity
- typically counted as positive
- result
- MPN statistically calculated from
- the number of positive vials
|
|
9
|
|
|
10
|
|
|
11
|
- First set of experiments typically had minimal downward trend of
decreasing bacteria concentration with time
- Generally low R2 values (best example shown)
- Colloidal silver stock solution about half the expected concentration
- Measured by ICP Mass Spectroscopy Method, Geology Lab
- Evidence that colloidal silver not a strong bactericide
- Altered procedure of experiments
|
|
12
|
- Second set of experiments:
- Increased test time, but experiments failed
- Problem of inconsistent initial bacteria concentration continued
- Bacteria stock left over weekend and fecal coliform food source used up,
so bacteria were no longer alive and/or other bacteria took over
- Stopped tests and designed different experiment to test colloidal silver
against other silver forms
|
|
13
|
- Batch tests with 4 different treatments used, all at 50 ug/L:
- Colloidal silver
- Silver ion (from silver nitrate)
- Colloidal silver permeable through 0.22 µm membrane (likely includes
both ions and small colloids)
- Control (zero silver)
- All 4 treatments run at same time to achieve similar initial bacteria
concentrations
- 4 replicates of the test conducted on different dates
- MPN technique used with two time points
|
|
14
|
- Colloidal silver concentration was 55% of expected, so manufacturer
reported value of 3.2% was in error
- Calculated silver ion concentration vs measured
- If measured lower than calculated, indicates silver sorption to
glassware, etc
- ~ 26% sorption of colloidal silver and 57% ion sorption indicated
- 77 % of the colloidal silver was <0.22 um in size
|
|
15
|
|
|
16
|
|
|
17
|
- Colloidal silver least effective silver treatment
- The inactivation of bacteria in the filtron may be due to: silver ions
dissolved into the water inside the filtron (and longer contact time for
the water)
- Future tests should explore higher silver concentrations, longer contact
times, and the filtron ceramic itself with and without silver in column
tests
|
|
18
|
- Conduct more batch tests using four treatment methods, varying silver
concentrations
- Ensure rigorous glassware washing between experiments and measure
aqueous silver concentrations at the end of each experiment
- Perform column tests to determine if Filtron behaves as predicted by the
batch tests
- Membrane Filter method for fecal coliform bacteria
- Using total coliform bacteria instead of fecal coliform bacteria
|
|
19
|
|

 Notes
Notes